
State of charge (SoC) tells you how much energy is available in an EV battery right now, while state of health (SoH) estimates how much capacity the battery retains compared with when it was new. SoC acts like a fuel gauge; SoH is closer to a measure of battery aging. They are different percentages, and a battery can show 100% SoC even after it has lost some of its original capacity.
For example, if an EV originally had 75 kWh of usable battery capacity and now retains 80%, its capacity-based SoH is about 80%, leaving 60 kWh when fully charged. At 50% SoC, roughly 30 kWh remains in that simplified example. Neither number alone tells you the exact miles the car can drive.
Battery-management systems estimate these values using measurements and models. SoC changes throughout a drive and charging session, while SoH generally changes more slowly as the battery ages.
In this article, I explain the differences, formulas, and real-world examples of SoC and SoH. I also cover their effects on EV range and charging, how to check battery health, what affects degradation, and what to look for when buying a used electric car.
State of Health vs State of Charge: Key Differences
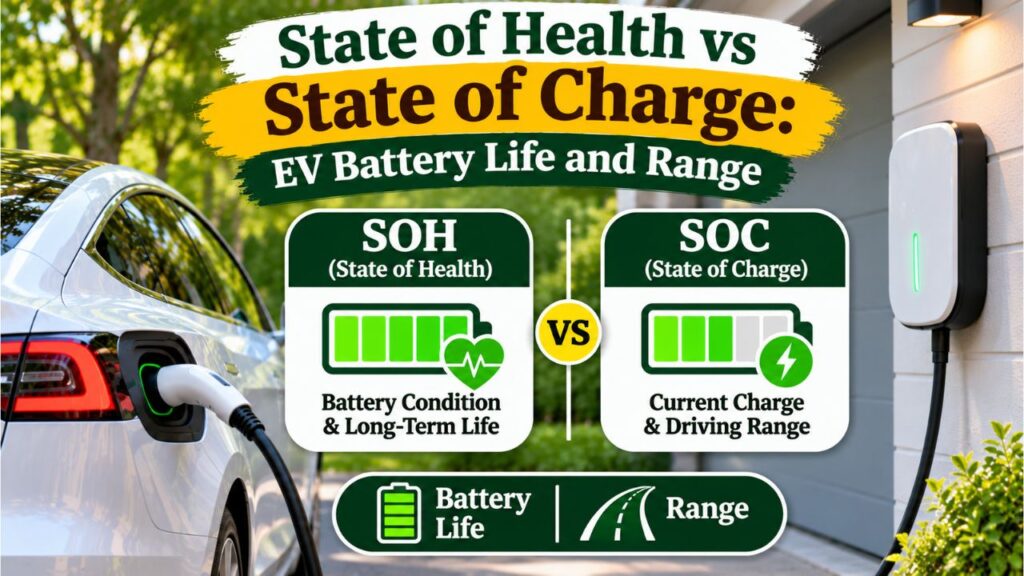
State of charge measures the battery’s current charge level. State of health describes its condition relative to a defined reference, usually its original capacity.
The two measurements answer different questions.
- SoC: How much battery charge is left right now?
- SoH: How much of the battery’s original capacity remains?
For example, an older EV may display 100% charge while storing less energy than it could when new.
This happens because 100% SoC generally means the battery is fully charged within its currently available operating window, not that it has recovered its original capacity.
SoC vs SoH Comparison Chart
| Feature | State of charge (SoC) | State of health (SoH) |
| Full name | State of Charge | State of Health |
| Main purpose | Shows current charge level | Indicates battery condition |
| Common abbreviation | SoC or SOC | SoH or SOH |
| Expressed as | Percentage | Usually percentage |
| Reference | Current available capacity or defined operating window | Original or specified reference capacity/performance |
| Changes while driving? | Yes | Generally changes slowly |
| Increases when charging? | Yes | Not normally |
| Returns to 100% after charging? | Yes, if fully charged | No, not simply from charging |
| Decreases with battery aging? | Not necessarily | Generally, for capacity-based SoH |
| Displayed on EV dashboard? | Commonly | Varies by vehicle |
| Primary use | Trip and charging planning | Battery aging and condition assessment |
| Important for used EV buyers? | Limited by itself | Yes, with supporting diagnostics |
The National Laboratory of the Rockies System Advisor Model documentation distinguishes battery state of charge from relative capacity, which describes how much maximum battery capacity remains compared with the original value.
Simple Example
Imagine two identical EVs that originally had 60 kWh of usable battery capacity.
Both show 100% SoC.
However:
- EV A has 100% capacity-based SoH and can still store approximately 60 kWh.
- EV B has 80% capacity-based SoH and can now store approximately 48 kWh.
Both batteries are fully charged relative to their current usable capacities.
But EV B stores approximately 12 kWh less energy.
Key Takeaway: A high SoC does not guarantee a healthy battery, and a low SoC does not mean the battery is degraded.
What Is State of Charge (SoC) in an EV Battery?
State of charge is the estimated percentage of the battery’s currently available charge relative to its full usable charge capacity or defined reference.
It is similar to the fuel gauge in a gasoline-powered car.
When the dashboard shows 70% battery, that is generally its displayed SoC.
What Does 100% SoC Mean?
100% SoC indicates that the battery has reached the upper end of the vehicle’s displayed charging window.
However, it does not necessarily mean every cell is at its absolute physical maximum capacity.
EV manufacturers often reserve some battery capacity above or below the displayed operating range.
These reserves help support battery protection and management.
Therefore, the dashboard’s 0–100% scale may not represent the entire physical charge range of the battery cells.
What Does 20% SoC Mean?
A 20% reading generally means approximately 20% of the battery’s current displayed usable capacity remains.
It does not mean the battery has lost 80% of its health.
For example, a battery at 20% SoC may still have 95% SoH.
The vehicle simply needs charging.
How Is State of Charge Calculated?
A simplified capacity-based formula is:
SoC (%) = Remaining charge capacity ÷ Current full charge capacity × 100
For a simplified energy-based EV example:
SoC (%) ≈ Remaining usable energy (kWh) ÷ Current full usable energy (kWh) × 100
Suppose an EV currently holds 30 kWh of usable energy and its present full usable capacity is 60 kWh.
Calculation:
30 ÷ 60 × 100 = 50%.
The estimated state of charge is 50%.
Actual battery-management systems use more sophisticated methods, and the energy fraction is not always numerically identical to the charge fraction.
How Does an EV Measure SoC?
An EV’s battery-management system (BMS) estimates SoC using information such as:
- Battery voltage
- Current flowing into and out of the battery
- Battery temperature
- Estimated battery capacity
- Charge and discharge history
- Battery models and calibration data
One common method is coulomb counting, which tracks electrical charge entering and leaving the battery.
The system may combine it with voltage-based methods and other estimation algorithms.
SoC is therefore an estimate, not a directly measured percentage stored inside the battery.
What Is State of Health (SoH) in an EV Battery?
State of health is an estimate of a battery’s present condition compared with a specified reference condition, usually when the battery was new.
For EVs, SoH most commonly refers to capacity retention.
Capacity retention describes how much energy the battery can still store compared with its original usable or rated capacity, using a consistent reference.
What Does 100% SoH Mean?
In a capacity-based system, 100% SoH generally means the battery retains its original reference capacity.
A new battery will normally be near this value.
However, manufacturers may define the reference differently.
A reported 100% does not establish that every aspect of battery performance is perfect.
What Does 90% SoH Mean?
A capacity-based SoH of 90% means the battery retains approximately 90% of its original reference capacity.
In simple terms, it has experienced approximately 10% capacity loss.
For a battery that originally provided 70 kWh of usable energy:
70 × 0.90 = 63 kWh.
Its present full usable energy would be approximately 63 kWh under equivalent measurement conditions.
What Does 80% SoH Mean?
An 80% capacity-based SoH indicates approximately 20% capacity loss relative to the original reference.
The battery may still work normally.
However, it generally provides less full-charge range than when it was new, assuming similar driving efficiency.
An 80% SoH reading does not automatically mean the battery must be replaced.
Replacement decisions depend on vehicle performance, fault conditions, manufacturer requirements, and warranty terms.
Does SoH Measure Only Capacity?
Not always.
Battery health can also involve:
- Internal resistance
- Power delivery capability
- Charging performance
- Self-discharge behavior
- Thermal characteristics
- Cell balance and consistency
Capacity-based SoH is most relevant to energy storage and potential driving range.
Resistance-based or power-related health measures describe different aspects of battery performance.
A 2026 technical review of EV battery health estimation distinguishes capacity-based SoH from resistance-based SoH and emphasizes that the two describe different types of degradation.
Because manufacturers do not all calculate SoH identically, percentages from unrelated vehicles should not be treated as perfectly comparable laboratory measurements.
How Is Battery State of Health Calculated?
The most common simplified calculation compares the battery’s current full charge capacity with its original reference capacity.
State of Health Formula
SoH (%) = Current full capacity ÷ Original full capacity × 100
For capacity measured in kilowatt-hours:
SoH (%) = Current full energy capacity (kWh) ÷ Original full energy capacity (kWh) × 100
The original and current values must use equivalent definitions and measurement conditions.
Example: Battery With 75 kWh Original Capacity
Suppose an EV originally had 75 kWh of usable battery capacity.
After several years, its measured usable capacity is approximately 63 kWh.
Calculation:
63 ÷ 75 × 100 = 84%.
The battery’s estimated capacity-based SoH is 84%.
Its estimated capacity degradation is:
100% − 84% = 16%.
Does Battery SoH Always Decrease?
Capacity-based battery health generally declines as a lithium-ion battery ages.
However, the displayed estimate can sometimes increase slightly after recalibration or updated BMS calculations.
That does not necessarily mean the battery has physically recovered lost capacity.
Instead, the system may have revised its estimate.
Battery capacity can also vary with test temperature and other conditions.
Why Isn’t SoH Measured Directly?
The battery’s condition cannot be determined accurately from a single voltage reading.
A reliable capacity assessment may require controlled charging and discharging under specified conditions.
Onboard systems therefore use measurements, historical data, and mathematical models to estimate battery health.
A 2023 peer-reviewed review, available through PubMed Central, explains why calculating SoH accurately inside a working vehicle remains challenging.
Can SoC Be 100% When SoH Is 80%?
Yes. This is one of the most important differences between state of charge and state of health.
SoC and SoH use different reference values.
Example: 75 kWh EV Battery
Suppose the EV originally had a usable capacity of 75 kWh.
Its capacity-based SoH is now 80%.
Current usable capacity:
75 × 0.80 = 60 kWh.
When the dashboard shows 100% SoC, the battery contains approximately 60 kWh of usable energy, not its original 75 kWh.
When the dashboard shows 50% SoC:
60 × 0.50 = 30 kWh.
The battery now contains approximately 30 kWh of usable energy.
SoC and SoH Energy Comparison
Assume every example uses the same original usable battery capacity of 75 kWh.
| SoH | Current full capacity | SoC | Estimated energy remaining |
| 100% | 75 kWh | 100% | 75 kWh |
| 100% | 75 kWh | 50% | 37.5 kWh |
| 90% | 67.5 kWh | 100% | 67.5 kWh |
| 90% | 67.5 kWh | 50% | 33.75 kWh |
| 80% | 60 kWh | 100% | 60 kWh |
| 80% | 60 kWh | 50% | 30 kWh |
| 80% | 60 kWh | 20% | 12 kWh |
| 70% | 52.5 kWh | 100% | 52.5 kWh |
These values are simplified examples and assume SoH is defined by usable capacity retention.
Real vehicles may have changing usable buffers, temperature-related limits, and proprietary state estimation methods.
Can SoH Be 100% When SoC Is 10%?
Yes.
A nearly new battery can have excellent health while containing very little charge.
For example:
- SoH: 100%
- SoC: 10%
The battery has not necessarily degraded.
It is simply close to the lower end of its displayed charging range.
Charging can restore SoC, but it does not automatically increase SoH.
How to Calculate Remaining Battery Energy From SoC and SoH
Both measurements can be combined to create a simplified estimate of remaining usable battery energy.
Combined Formula
Remaining energy (kWh) ≈ Original usable capacity × (SoH ÷ 100) × (SoC ÷ 100)
This assumes capacity-based SoH and a displayed SoC referenced to current usable capacity.
Example Calculation
Suppose:
- Original usable battery capacity: 80 kWh
- Current SoH: 85%
- Current SoC: 60%
First, calculate the current full usable capacity:
80 × 0.85 = 68 kWh.
Then calculate the estimated remaining energy:
68 × 0.60 = 40.8 kWh.
The estimated energy remaining is 40.8 kWh.
Why This Formula Is Only an Estimate
Actual usable energy may differ because of:
- Battery temperature
- Differences between gross and usable capacity
- Manufacturer-reserved capacity
- SoC estimation error
- Battery degradation characteristics
- Operating limitations
Do not substitute a vehicle’s gross battery capacity into a formula that assumes original usable capacity without accounting for the difference.
State of Charge vs State of Health: Effect on EV Driving Range
Both SoC and SoH influence how far an EV can travel, but in different ways.
SoC affects the range available during the current trip. SoH influences the battery’s longer-term energy-storage potential.
How SoC Affects Range
As the vehicle consumes energy, SoC decreases.
For example, if an EV currently has 30 kWh of usable energy and averages 3 miles per kWh:
30 × 3 = 90 miles.
Its approximate remaining range is 90 miles under those assumed conditions.
However, actual driving range depends on efficiency.
How SoH Affects Range
A battery with reduced capacity generally stores less energy at full charge.
Suppose an EV originally offered 300 miles of range under a particular set of conditions.
If usable battery capacity decreases by 20%, and energy consumption per mile remains unchanged, a simplified estimate is:
300 × 0.80 = 240 miles.
This suggests approximately 240 miles of full-charge range under equivalent conditions.
It does not guarantee that the car will display or achieve exactly 240 miles.
Range Example at Different SoH Values
Assume a new EV could travel 300 miles under identical test conditions.
| Capacity-based SoH | Approximate full-charge range |
| 100% | 300 miles |
| 95% | 285 miles |
| 90% | 270 miles |
| 85% | 255 miles |
| 80% | 240 miles |
| 75% | 225 miles |
| 70% | 210 miles |
This is a mathematical illustration assuming that range changes in proportion to usable capacity.
In real driving, efficiency and battery-management behavior can change the results.
Why Range Loss Doesn’t Always Mean Low SoH
Driving range can decrease for reasons unrelated to permanent battery degradation.
Common examples include:
- Cold weather
- Cabin heating
- High highway speeds
- Strong headwinds
- Hills
- Towing
- Heavy cargo
- Tire pressure
- Driving habits
The U.S. Department of Energy’s Alternative Fuels Data Center explains that EV range depends on temperature, speed, HVAC use, driving conditions, and vehicle load.
Important: A lower range estimate on your dashboard is not enough to determine battery SoH.
How SoC and SoH Affect EV Charging Speed
SoC and SoH can both influence charging performance, but they do so differently.
How SoC Affects Fast Charging
DC fast-charging power often changes with the battery’s state of charge.
Many EVs charge faster at lower or intermediate SoC levels and reduce charging power as the battery approaches full charge.
This helps protect the battery and manage voltage, current, and temperature.
For example, an EV may accept high charging power at 30% SoC but significantly less power at 90% SoC.
That behavior does not automatically indicate poor battery health.
The U.S. Department of Energy’s winter EV charging advice notes that many EV batteries reduce DC charging power between approximately 80% and 100% SoC.
How SoH Affects Charging
Aging can change a battery’s:
- Internal resistance
- Heat generation
- Charge acceptance
- Maximum usable capacity
- Power capability
These changes may influence charging performance.
However, a lower SoH percentage does not always translate into a predictable reduction in peak charging power.
Actual behavior depends on the vehicle’s battery chemistry, cooling system, and charging controls.
Can an EV With 80% SoH Still Fast Charge?
Yes.
An EV with 80% capacity-based SoH may still support DC fast charging.
However, charging behavior should be evaluated using the vehicle’s specifications and actual diagnostic information.
A single slow charging session does not prove the battery is degraded.
Cold temperature, high starting SoC, charger limitations, and battery conditioning can also reduce charging speed.
How to Check State of Charge in an EV
SoC is generally easy to check.
Most EV dashboards display the battery’s current charge percentage.
Method 1: Vehicle Dashboard
Check the instrument cluster or center display.
The battery indicator may show:
- Current battery percentage
- Estimated remaining range
- Charging status
- Selected charge limit
The percentage is typically the displayed SoC.
Method 2: Manufacturer Mobile App
Many EV manufacturers provide mobile apps that display charging information.
Depending on the vehicle, an app may show:
- Current SoC
- Charging progress
- Charge limit
- Estimated completion time
- Charging notifications
Method 3: Vehicle Diagnostics
Vehicle diagnostic systems may provide battery measurements and additional SoC information.
However, the available data and accuracy depend on the vehicle and diagnostic tool.
Do not assume that every OBD-II scanner supports EV-specific battery information.
How to Check State of Health in an EV
SoH is generally harder to verify than SoC because many vehicles do not display a simple battery-health percentage on the main dashboard.
The available methods depend on the manufacturer.
Method 1: Built-In Battery Health Display
Some EVs provide a battery-health indicator or capacity estimate in their settings.
If available, check the vehicle’s documentation to understand what the reported value represents.
For example, certain Ford vehicles display battery SoH as a percentage of the original certified energy capacity.
The reported value may require calibration or updating under manufacturer-specified conditions.
Method 2: Manufacturer Battery Health Test
Some manufacturers provide a dedicated diagnostic test.
For example, Tesla documents a battery-health test for supported vehicles.
According to Tesla’s range and battery health support page, eligible vehicles may provide a Battery Health Test through the vehicle’s service interface.
Availability varies by model and software.
Such tests can have specific charging, temperature, and operating requirements.
Follow the manufacturer instructions rather than performing arbitrary deep-discharge tests.
Method 3: Diagnostic Scan Tools
Some professional or model-specific diagnostic tools can retrieve BMS information such as:
- Estimated remaining capacity
- Battery-health data
- Cell voltage differences
- Battery temperature
- Diagnostic fault codes
- Charging or discharge history
However, a reported number may be a calculated estimate, raw parameter, or manufacturer-specific diagnostic value.
It should not be interpreted without understanding the data definition.
Method 4: Professional Capacity Test
A controlled battery-capacity test can provide stronger evidence of energy retention.
However, accurate testing requires appropriate procedures and measurement conditions.
For an EV high-voltage battery, this should be performed through manufacturer-supported diagnostic methods or qualified professionals.
Never attempt to open or directly test an EV high-voltage battery pack with ordinary DIY electrical equipment.
Can You Estimate SoH From Full-Charge Range?
Only roughly, and often unreliably.
The displayed full-charge range may depend on driving habits, temperature, vehicle software, and battery calibration.
Even when range estimates are based on rated efficiency, differences in usable battery capacity definitions and BMS estimation can create uncertainty.
A verified battery-health test is preferable.
What Is a Good State of Health for an EV Battery?
There is no universal SoH percentage that guarantees a battery is good or bad.
The interpretation depends on age, mileage, battery chemistry, vehicle design, and test method.
Understanding Different SoH Readings
| Capacity-based SoH | General interpretation |
| 100% | Approximately original reference capacity |
| 95% | Approximately 5% capacity loss |
| 90% | Approximately 10% capacity loss |
| 85% | Approximately 15% capacity loss |
| 80% | Approximately 20% capacity loss |
| 75% | Approximately 25% capacity loss |
| 70% | Approximately 30% capacity loss |
These percentages describe capacity retention, not a universal battery-condition grading system.
For example, 85% SoH does not automatically mean the battery is defective.
A used EV may remain completely practical with reduced capacity if its remaining range meets the owner’s needs.
Is 90% SoH Good?
A 90% capacity-based SoH indicates approximately 10% capacity loss.
Whether that is reasonable depends on the battery’s age, mileage, and model.
Compare the reading with reliable information for the same vehicle and battery specification.
Is 80% SoH Bad?
Not necessarily.
An EV with 80% remaining capacity may still provide useful range.
However, the reduction may matter for long-distance driving, resale value, or warranty eligibility.
Does 70% SoH Mean the Battery Is Dead?
No.
A battery at 70% capacity-based SoH may still operate.
However, its range is significantly reduced compared with its original capacity.
Some EV battery warranties use capacity-retention thresholds, but the requirements differ by manufacturer, model, market, and warranty period.
The U.S. Department of Energy’s EV battery guidance notes that batteries retaining around 70% of their initial capacity may still be useful in other energy-storage applications.
That is not a universal rule for when an EV battery must be replaced.
What Causes EV Battery State of Health to Decrease?
Lithium-ion batteries gradually age through chemical and physical changes.
Two broad mechanisms are calendar aging and cycle aging.
1. Calendar Aging
Calendar aging occurs as time passes, even when the battery is not being actively used.
Its rate depends on factors including:
- Temperature
- Battery chemistry
- Storage SoC
- Battery design
- Time spent under different conditions
A vehicle that sits unused for long periods can still experience battery aging.
2. Cycle Aging
Cycle aging results from charging and discharging the battery.
It depends on factors such as:
- Total energy throughput
- Charge and discharge current
- Battery temperature
- Depth of discharge
- Battery chemistry
- Charging strategy
Not all partial charge cycles create the same amount of degradation.
3. High Temperatures
High temperatures can accelerate battery degradation.
Thermal-management systems help maintain the battery within suitable operating conditions.
However, extreme heat, especially during prolonged storage or demanding use, can increase aging.
4. Charging Habits
Some charging patterns place more stress on particular lithium-ion battery chemistries.
For certain vehicles, spending long periods at a very high SoC may accelerate degradation.
Repeated high-power charging under unfavorable conditions may also contribute to battery stress.
However, the correct charging routine depends on the manufacturer’s battery chemistry and management system.
5. Battery Chemistry
Lithium-ion EV batteries are not all identical.
Examples include:
- Lithium iron phosphate (LFP)
- Nickel manganese cobalt (NMC or NCM)
- Nickel cobalt aluminum (NCA)
These chemistries differ in characteristics such as thermal behavior, energy density, and aging.
Do not assume a charging recommendation for one battery chemistry applies to every EV.
How to Maintain Good Battery State of Health
Battery aging cannot be eliminated, but appropriate charging and operating habits can help manage long-term degradation.
Follow the Manufacturer’s Charge Limits
Some manufacturers recommend a lower daily charging limit for particular batteries.
For example, Tesla advises owners of vehicles with an 80% recommended daily charge limit to use that limit for everyday charging and increase it when additional range is needed.
However, this is not a universal 80% rule.
Understand LFP Battery Recommendations
Some EVs with lithium iron phosphate batteries have different charging recommendations.
For example, Ford’s Mustang Mach-E charging guidance recommends charging certain LFP-equipped models to 100% at least monthly to support range-estimation accuracy.
Other battery configurations may recommend different daily charge limits.
Always follow the instructions for your exact vehicle and battery.
Avoid Unnecessary Extreme Charge Levels
For vehicles where the manufacturer recommends it, avoid leaving the battery near its displayed minimum or maximum for extended periods.
This is especially relevant during long-term storage.
However, charging to 100% when needed for a long trip is not automatically harmful or prohibited.
Manage Battery Temperature
Use manufacturer-provided battery conditioning and thermal-management features where appropriate.
Avoid unnecessary exposure to extreme heat.
For long-term parking or storage, follow the vehicle’s temperature and charge-level guidance.
Use DC Fast Charging Appropriately
DC fast charging is useful for road trips and situations requiring rapid energy replenishment.
However, battery temperature and SoC affect charging performance.
Use battery preconditioning when supported and follow the vehicle’s charging recommendations.
Avoid Leaving the Battery Fully Depleted
Very low displayed SoC can create operational risks, particularly during extended storage.
Recharge according to the manufacturer’s instructions.
Do not deliberately deep-discharge an EV as an improvised battery-health test.
State of Health vs State of Charge When Buying a Used EV
For used EV buyers, understanding both measurements can help avoid confusion.
SoC tells you how charged the vehicle is at inspection. SoH can provide information about long-term battery capacity retention.
What to Check Before Buying
| Item | Why it matters |
| Current SoC | Shows available charge for a test drive |
| Battery SoH or verified capacity | Helps assess long-term capacity loss |
| Battery age | Provides context for degradation |
| Mileage | Indicates usage, though not complete aging history |
| Service history | May reveal battery repairs or replacements |
| Battery fault warnings | May indicate a diagnostic problem |
| Charging behavior | Can help identify abnormal operation |
| Remaining warranty | Determines potential manufacturer coverage |
| Real-world range | Helps assess practical suitability |
| Battery-health test method | Determines how much confidence to place in the result |
Why a 100% Charged Used EV Can Be Misleading
A vehicle may show a full charge while retaining considerably less usable energy than it did when new.
Therefore, SoC alone does not establish battery quality.
Should You Trust a Third-Party SoH Report?
Third-party reports can be useful, but their accuracy and methodology vary.
Ask whether the value comes from:
- A manufacturer-supported battery test
- Direct BMS capacity data
- Model-specific diagnostic analysis
- An algorithm estimating degradation from driving or charging behavior
A clearly documented, model-appropriate capacity assessment is more informative than an unexplained battery-health percentage.
Should You Compare SoH Across Different Brands?
With caution.
Different manufacturers may use different reference capacities, battery reserves, and estimation methods.
An 88% SoH report from one model is not automatically equivalent to an 88% reading from another model.
Compare vehicles using the same methods and relevant model-specific information whenever possible.
Common Mistakes When Comparing SoC and SoH
| Mistake | Why it is incorrect |
| Thinking 100% SoC means 100% SoH | A degraded battery can still charge fully |
| Thinking 20% SoC means 80% battery degradation | SoC measures charge level, not aging |
| Assuming charging restores SoH | Charging normally restores charge, not lost capacity |
| Treating dashboard range as an exact SoH measurement | Range also depends on driving and temperature |
| Assuming every SoH system uses the same formula | Manufacturer methods and reference values differ |
| Assuming 80% SoH requires immediate replacement | Replacement depends on more than one percentage |
| Using gross battery capacity in a usable-capacity formula | Gross and usable capacity differ |
| Performing deep-discharge tests without guidance | Can create risks and may not produce useful results |
| Applying one charging limit to all EV chemistries | Manufacturer recommendations differ |
| Assuming a slow fast-charging session proves poor SoH | Temperature, station power, and SoC also matter |
Understanding the measurement method is essential when interpreting battery-health information.
SoC vs SoH vs Depth of Discharge: What Is the Difference?
Another battery term often appears alongside SoC and SoH: depth of discharge.
State of Charge (SoC)
SoC describes the charge remaining within the defined operating window.
For example, 60% SoC means the battery has approximately 60% of its current displayed charge range remaining.
State of Health (SoH)
SoH describes battery condition relative to a reference state.
For capacity-based SoH, it indicates how much full-charge capacity remains compared with the original value.
Depth of Discharge (DoD)
Depth of discharge describes how much of a defined battery capacity has been discharged.
In a simplified calculation:
DoD (%) = 100% − SoC (%)
For example:
If SoC = 30%,
DoD = 70%.
However, practical cycle depth can also refer to the difference between the starting and ending SoC of a particular discharge event.
A discharge from 80% to 30% SoC represents a 50-percentage-point operating-window swing.
Comparison
| Metric | What it measures |
| SoC | Current charge level |
| SoH | Long-term battery condition |
| DoD | How much of a defined capacity has been discharged |
All three measurements can help describe battery operation, but they are not interchangeable.
Conclusion
The difference between state of health vs state of charge is straightforward: SoC describes how much battery charge is currently available, while SoH describes the battery’s condition relative to its original reference.
An EV can show 100% SoC while having only 80% capacity-based SoH. In that situation, the battery is fully charged but stores less energy than it did when new.
SoC changes regularly during driving and charging. SoH generally changes more slowly as the battery ages through time and use.
I recommend using SoC for daily driving, trip planning, and charging decisions. Use SoH, preferably supported by reliable diagnostics, to assess battery aging, remaining usable capacity, and potential long-term range.
When buying a used EV, look beyond the dashboard charge percentage. Review the battery-health report, warranty, service history, and actual vehicle performance.
Finally, remember that SoH is an estimate and manufacturers may calculate it differently.
Understanding both measurements gives you a clearer picture of what an EV battery can deliver today and how its energy-storage capability has changed over time.
FAQs About State of Health vs State of Charge
What Is the Main Difference Between SoC and SoH?
State of charge (SoC) describes the battery’s current charge level.
State of health (SoH) describes the battery’s condition relative to a reference, usually its original capacity.
SoC changes while charging or driving, while SoH generally changes gradually as the battery ages.
Can an EV Have 100% SoC and 80% SoH?
Yes.
A battery with 80% capacity-based SoH can still reach 100% displayed SoC.
However, it stores approximately 80% of its original reference capacity when fully charged, assuming equivalent measurement conditions.
Does Charging an EV Increase State of Health?
No, not normally.
Charging increases SoC by replenishing stored energy.
It does not reverse the battery’s underlying chemical aging.
A recalibrated BMS may occasionally revise its SoH estimate upward, but that does not necessarily indicate physical capacity recovery.
Is 80% Battery State of Health Good?
An 80% capacity-based SoH indicates approximately 20% capacity loss.
The battery may still be useful, depending on the vehicle and required driving range.
Whether this is acceptable depends on age, mileage, performance, warranty conditions, and owner needs.
Can State of Health Be Higher Than 100%?
Some estimation systems may report unusual values due to their reference definitions or calibration.
However, capacity-based SoH is generally presented relative to the battery’s original capacity, with 100% representing that reference.
Values above 100% should be interpreted according to the manufacturer’s specific measurement method.
Does SoH Affect EV Driving Range?
Yes.
Lower capacity-based SoH generally means less energy can be stored at full charge.
That can reduce maximum driving range under comparable conditions.
However, weather, driving speed, cabin heating, and other factors also influence range.
How Can I Check My EV Battery’s SoH?
Check whether the vehicle provides a built-in battery-health display or manufacturer-supported test.
Some vehicles also support model-specific diagnostic tools.
For an accurate assessment, use an approved battery-health test or qualified EV service provider.
Is State of Charge the Same as Battery Percentage?
Usually, yes, in everyday EV use.
The battery percentage displayed on the dashboard generally represents the vehicle’s estimated SoC within its defined usable operating window.
It does not directly indicate battery SoH.
Does Low SoC Damage an EV Battery?
A low SoC reading does not automatically mean damage has occurred.
However, leaving certain lithium-ion batteries at extremely low charge levels for extended periods can create problems.
Follow the vehicle manufacturer’s charging and storage guidance.
What Is More Important When Buying a Used EV: SoC or SoH?
SoH is generally more informative for evaluating long-term battery capacity.
SoC only tells you the vehicle’s current charge level.
However, battery SoH should be assessed alongside warranty coverage, vehicle age, service records, and diagnostic results.
Can Two EVs With the Same SoC Have Different Ranges?
Yes.
They may have different battery capacities, states of health, efficiency, and driving conditions.
Even two identical models showing 80% SoC may offer different usable energy if one battery has lost more capacity.
Is Battery SoH the Same as Battery Degradation?
They are closely related but not identical terms.
Capacity-based SoH represents the percentage of original capacity remaining.
Capacity degradation represents the percentage lost.
For a simplified capacity-based calculation:
Capacity degradation (%) = 100% − SoH (%)
Therefore, 85% SoH corresponds to approximately 15% capacity degradation.